Image Details
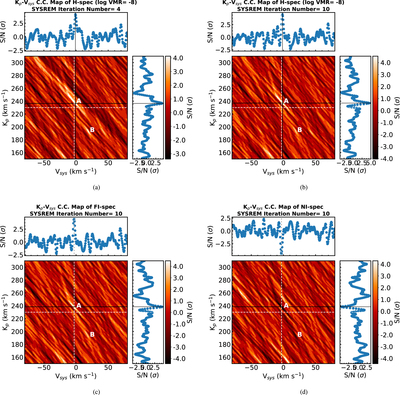
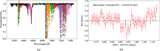
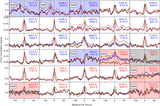
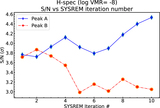
Caption: Figure 9.
Panels (a) and (b) show the Kp–Vsys cross-correlation map of H-spec (log VMR = −8) for SYSREM iteration numbers = 4 and 10, respectively. Panels (c) and (d) are the Kp–Vsys cross-correlation map of FI-spec and NI-spec, respectively, for SYSREM iteration number = 10. The white dashed line is the expected Kp and Vsys from previous studies. The black line is the maximum S/N peak in the map. The top and right panels show the one-dimensional cross-section of the CCF peak along Vsys and Kp, respectively. A and B denote peak A and peak B, respectively.
Other Images in This Article
Show More
Copyright and Terms & Conditions
© 2017. The American Astronomical Society. All rights reserved.
Copyright ©
2026 Astronomy Image Explorer. All Rights Reserved.