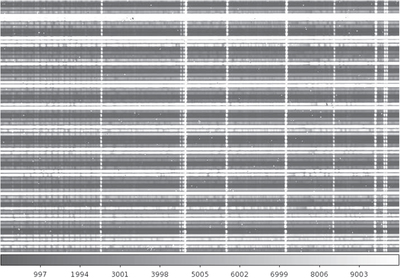
Image Details

Choose export citation format:

The Apache Point Observatory Galactic Evolution Experiment (APOGEE)

  • Authors: Steven R. Majewski, Ricardo P. Schiavon, Peter M. Frinchaboy, Carlos Allende Prieto, Robert Barkhouser, Dmitry Bizyaev, Basil Blank, Sophia Brunner, Adam Burton, Ricardo Carrera, S. Drew Chojnowski, Kátia Cunha, Courtney Epstein, Greg Fitzgerald, Ana E. García Pérez, Fred R. Hearty, Chuck Henderson, Jon A. Holtzman, Jennifer A. Johnson, Charles R. Lam, James E. Lawler, Paul Maseman, Szabolcs Mészáros, Matthew Nelson, Duy Coung Nguyen, David L. Nidever, Marc Pinsonneault, Matthew Shetrone, Stephen Smee, Verne V. Smith, Todd Stolberg, Michael F. Skrutskie, Eric Walker, John C. Wilson, Gail Zasowski, Friedrich Anders, Sarbani Basu, Stephane Beland, Michael R. Blanton, Jo Bovy, Joel R. Brownstein, Joleen Carlberg, William Chaplin, Cristina Chiappini, Daniel J. Eisenstein, Yvonne Elsworth, Diane Feuillet, Scott W. Fleming, Jessica Galbraith-Frew, Rafael A. García, D. Aníbal García-Hernández, Bruce A. Gillespie, Léo Girardi, James E. Gunn, Sten Hasselquist, Michael R. Hayden, Saskia Hekker, Inese Ivans, Karen Kinemuchi, Mark Klaene, Suvrath Mahadevan, Savita Mathur, Benoît Mosser, Demitri Muna, Jeffrey A. Munn, Robert C. Nichol, Robert W. O'Connell, John K. Parejko, A. C. Robin, Helio Rocha-Pinto, Matthias Schultheis, Aldo M. Serenelli, Neville Shane, Victor Silva Aguirre, Jennifer S. Sobeck, Benjamin Thompson, Nicholas W. Troup, David H. Weinberg, and Olga Zamora

2017 The Astronomical Journal 154 94.

  • Provider: AAS Journals

Caption: Figure 14.

Portion of a raw 2D APOGEE image from observations of a bulge field. The horizontal stripes correspond to individual stellar spectra. Vertical bright bands correspond to airglow features at the same rest wavelength in each spectrum, whereas absorption features at the same horizontal position from spectrum to spectrum correspond to telluric absorption features. Also obvious are variations in the expression of stellar atmospheric absorption features from star to star, evidenced by their varying strengths due to temperature and chemical composition differences, as well as changing relative positions due to Doppler shifts. Fiber assignments were managed by color-coding fiber holes in the plugplates (see Figure 13) and the fiber optic jackets at the telescope end to correspond to stars in each field sorted into three brightness groups (bright, medium, faint). These fibers were sorted at the spectrograph slit head into a repeating pattern of faint−medium−bright−bright−medium−faint to minimize the contamination of any given spectrum by the PSF wings of a much brighter spectrum in an adjacent fiber. This management scheme gives rise to the brightness modulation pattern apparent in this image.

Other Images in This Article

Show More

Copyright and Terms & Conditions