Image Details
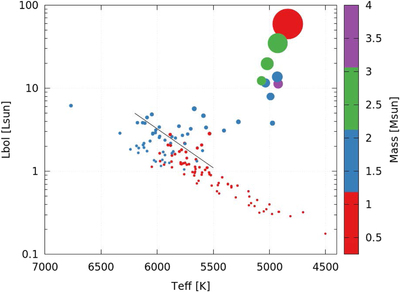
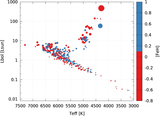
Caption: Figure 13.
H–R diagram of stars in our sample with the most accurate stellar mass determinations, ﹩{\sigma }_{{M}_{\star }}\lt 15 \% ﹩. Color represents ﹩{M}_{\star }﹩ and symbol size is proportional to ﹩{R}_{\star }﹩. The black line denotes our separation of dwarfs from subgiants/giants. The majority of the evolved stars have ﹩{M}_{\star }﹩ > 1.2 ﹩{M}_{\odot }﹩ (blue, green, or purple colors).
Other Images in This Article
Show More
Copyright and Terms & Conditions
© 2017. The American Astronomical Society. All rights reserved.
Copyright ©
2025 Astronomy Image Explorer. All Rights Reserved.