Image Details
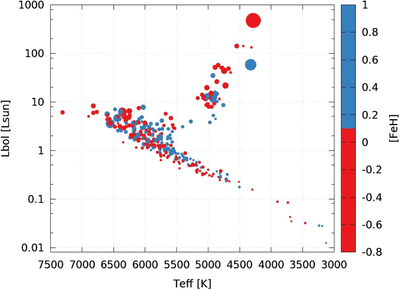
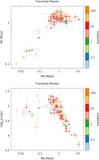
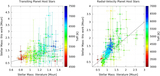
Caption: Figure 5.
Hertzsprung–Russel diagram of all planets in our study sample. Symbol size is proportional to ﹩{M}_{\star }﹩, which for transiting planets is derived from the transit-based ﹩{\rho }_{\star }﹩ and for RV planets is derived from ﹩\mathrm{log}g﹩ (see the text). Color represents [Fe/H]. The separation of metal-poor stars below the metal-rich stars on the main sequence is readily apparent. All quantities represented are determined empirically.
Other Images in This Article
Show More
Copyright and Terms & Conditions
© 2017. The American Astronomical Society. All rights reserved.
Copyright ©
2025 Astronomy Image Explorer. All Rights Reserved.