Image Details
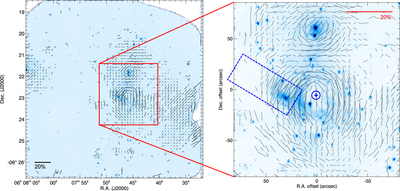
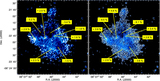
Caption: Figure 3.
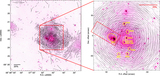
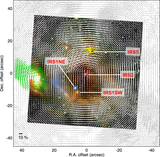
J polarization vector map superimposed on the Stokes I images. The length of the vectors is proportional to the degree of polarization. A 20% vector is shown: bottom left in the left-hand image; top right in the right-hand image. In the left-hand image, the vectors are smoothed by 6 × 6 pixels (twice the seeing size), and the vectors are shown every 18 pixels for intensities greater than 3σ, 6σ, and 3σ above the mean sky level, for the J, H, and Ks bands, respectively, where σ is the standard deviation of the sky brightness. In the right-hand image, the same smoothing is used with the vectors shown every 12 pixels for intensities greater than 3σ above the mean sky level, for the JHKs bands. The plus symbol in a circle indicates the expected location of the illuminating source IRS 2, and the blue box (Figure 3), green box (Figure 4), and red box (Figure 5) in each right-hand image indicates the nebulosity of IRS 3 in the J, H, and Ks bands, respectively.
Other Images in This Article
Show More
Copyright and Terms & Conditions
© 2016. The American Astronomical Society. All rights reserved.