Image Details
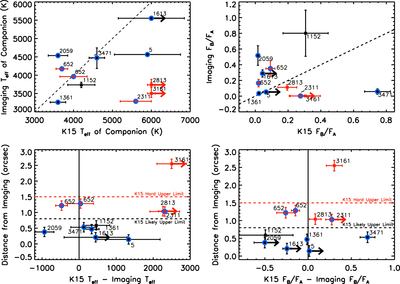
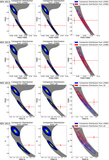
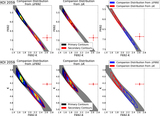
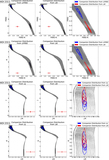
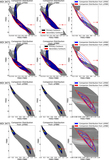
Caption: Figure 9.
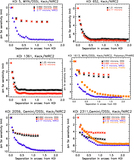
Plots showing parameter comparisons for companions found through K15's analysis, and derived from our analysis of imaging data. The labels refer to the companion's primary KOI. Blue circles indicate KOIs with imaging data in multiple bands, and red symbols indicate the imaging-detected companion is >0.″8 away from the primary KOI. The values plotted here for the companion to KOI 3471 assume a subigant primary star. Note that the “imaging” values are those derived from our analysis in Section 3.1, and thus may be incorrect if the companion is unbound. Top left: Teff values of the companions. Top right: flux ratios (companion/primary) of the companions. The flux ratios measured from imaging data are in the Kepler bandpass. Bottom left: difference in derived Teff values, vs. the separation as measured from imaging data (averaged over all detections). Dashed horizontal lines designate the separation limits reported in K15. Bottom right: difference in derived flux ratios of companions, vs. the separation as measured from imaging data (averaged over all detections). Dashed horizontal lines designate the separation limits reported in K15.
Other Images in This Article
Show More
Copyright and Terms & Conditions
© 2015. The American Astronomical Society. All rights reserved.