Image Details
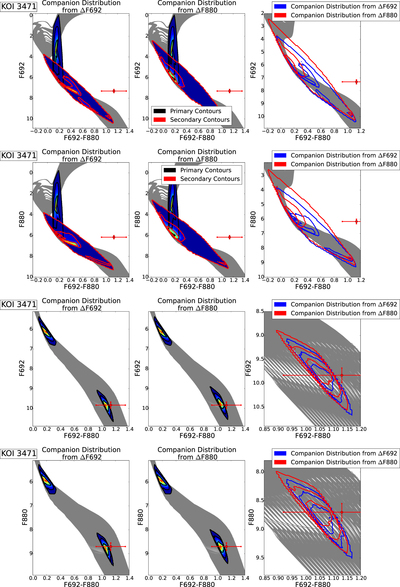
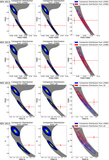
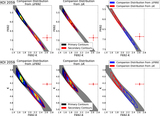
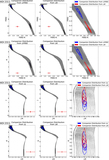
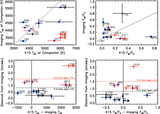
Caption: Figure 7.
Plots showing the results of the imaging data analysis in Section 3.1 for KOI 3471. The top two rows show results based on the Huber et al. (2014) parameters for KOI 3471, classifying it as a subgiant. The bottom two rows show results based on a dwarf-like log g for KOI 3471 (4.6 ± 0.02); see Section 4.2.2. Left plots: primary KOI absolute photometry contours, and companion photometry contours, calculated from observed ΔF692 magnitude and assuming it lies at the same distance and has the same age and metallicity as the KOI, mapped on the same (primary KOI) isochrone. The red point represents the absolute magnitude and “true” color for the companion (assuming it is bound), calculated from relative color information. The spread in color of the contours represents the spread in the normalized probability distribution, ranging from 1 (red) to 0 (dark blue). Middle plots: Same as left, but with companion photometry contours calculated from ΔF880 magnitude. Right plots: a comparison of the overlap between the relative photometry contours of the companion. The red point here is the same as in the left and middle panels.
Other Images in This Article
Show More
Copyright and Terms & Conditions
© 2015. The American Astronomical Society. All rights reserved.