Image Details
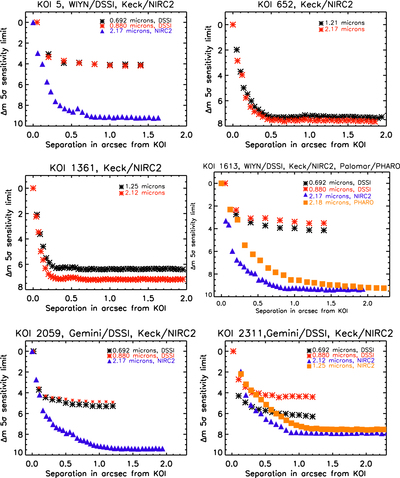
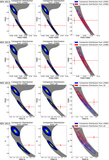
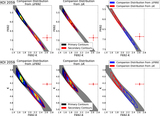
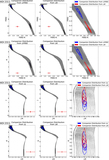
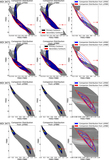
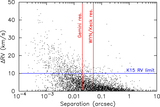
Caption: Figure 10.
Curves depicting the 5σ sensitivity limits of the imaging observations for each KOI in the K15 sample with a detection in imaging data. Different colors and points correspond to different wavelengths and instruments of the observations.
Other Images in This Article
Show More
Copyright and Terms & Conditions
© 2015. The American Astronomical Society. All rights reserved.
Copyright ©
2025 Astronomy Image Explorer. All Rights Reserved.