Image Details

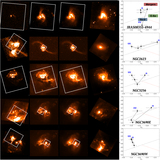
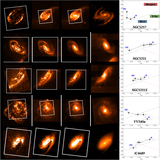
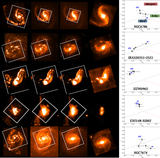
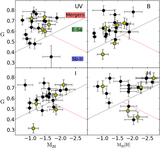
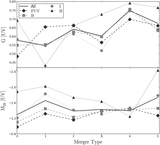
Caption: Figure 7.
The four panels on the left show the G-M20 values for the FUV rest-frame redshifted images. For each redshift bin, we connect the G-M20 values from an objectʼs lower redshift (gray) to its higher redshift (open circles) as defined in the legend. The two panels on the right show the average G and M20 values with simulated redshift (black circles). The vertical lines span the minimum and maximum values for that redshift bin. The dashed and solid lines illustrate the trend for G to decrease and flatten with increasing redshift, while M20 remains relatively stable.
Other Images in This Article

Show More
Copyright and Terms & Conditions
© 2014. The American Astronomical Society. All rights reserved.
Copyright ©
2024 Astronomy Image Explorer. All Rights Reserved.