Image Details
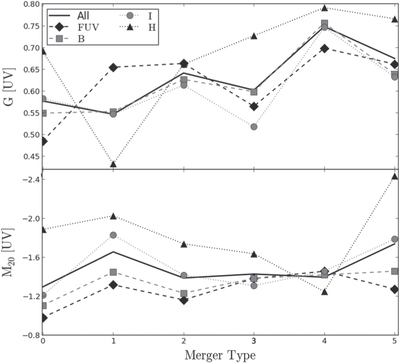
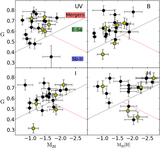
Caption: Figure 3.
Plots are of the average G (top) and M20 (bottom) values in different wavebands compared to the visual classification type (Table 1). Black diamonds, gray squares, gray circles, and black triangles are the mean values in the FUV, B, I, and H bands, respectively. The black solid line is the average for all values in that classification type.
Other Images in This Article

Show More
Copyright and Terms & Conditions
© 2014. The American Astronomical Society. All rights reserved.
Copyright ©
2024 Astronomy Image Explorer. All Rights Reserved.