Image Details
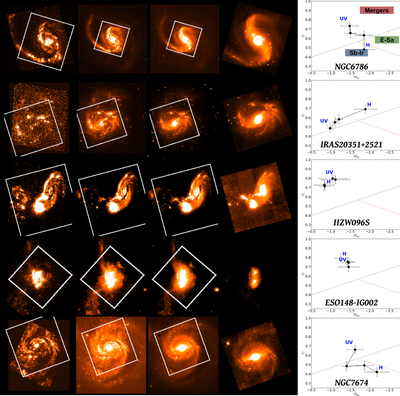
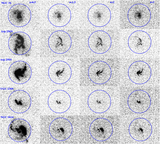
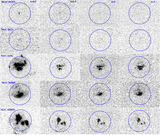
Caption: Figure 1.
GOALS subsample in the FUV, B, I, and H bands (left to right). The H-band footprint is outlined in a white box region. Individual plots of the G-M20 morphologies are shown to trace the behavior with wavelength. The individual G-M20 plots to the right of the image cutouts are the FUV-, B-, I-, and H-band values (UV and H are annotated).
Other Images in This Article

Show More
Copyright and Terms & Conditions
© 2014. The American Astronomical Society. All rights reserved.
Copyright ©
2024 Astronomy Image Explorer. All Rights Reserved.