Image Details
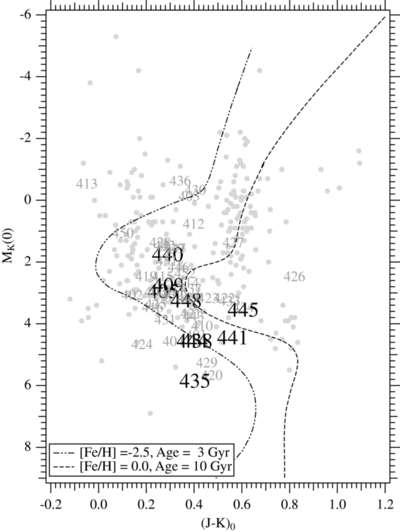
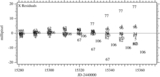
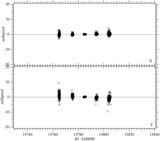
Caption: Figure 17.
H-R diagram for the Section 5.5 reference stars and the Table 4 KOIs. MK(0) are calculated using the Figure 2 linear mapping between MK(0) and HK(0) after applying the Section 5.8 systematic correction to HK(0). KOI labeling is the same as in Figure 16 on the right. Lines show predicted loci for 10 Gyr age solar metallicity stars (- - -) and 3 Gyr age metal-poor stars (-· ·-) from Dartmouth Stellar Evolution models (Dotter et al. 2008). Note the large number of KOI sub-giants.
Other Images in This Article

Show More
Copyright and Terms & Conditions
© 2014. The American Astronomical Society. All rights reserved.
Copyright ©
2025 Astronomy Image Explorer. All Rights Reserved.