Image Details

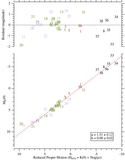
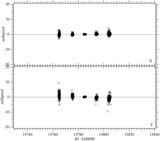
Caption: Figure 16.
Left: RPM from the results of modeling Kepler, UCAC4, and PPMXL data. The average HK(0) and (J − K)0 ±1σ errors are indicated in the lower left. That error is reduced by a factor of three compared to an RPM derived by averaging proper motions from UCAC4 and PPMXL. The heavy, tilted line is the location of the main sequence in the Figure 1 RPM derived from all-sky HST proper motions. Note the vertical offset in HK(0) discussed in the text. Right: RPM with a ΔHK(0) = −1.0 correction, containing the KOI, also shifted. Plotted numbers are from Table 4. The horizontal dotted line represents a rough demarcation between giant and dwarf stars.
Other Images in This Article

Show More
Copyright and Terms & Conditions
© 2014. The American Astronomical Society. All rights reserved.