Image Details
Caption: Figure 7.
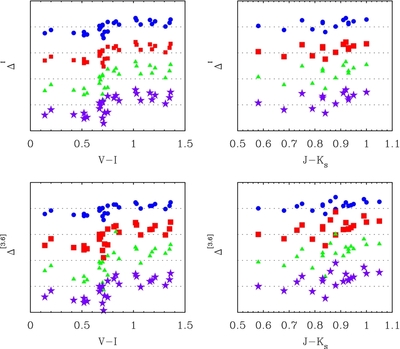
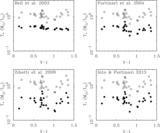
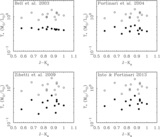
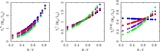
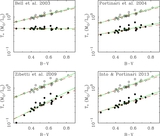
Offset in mass-to-light ratios in the I-band (top row) and [3.6] (bottom row) as a function of a second color: V − I (left column) and J − K (right column). Δ is the logarithmic offset between the mass-to-light ratio that gives self-consistent stellar masses (Table 4) and that approximated from the mean trend with B − V color (Table 5). The offsets for each population model have been shifted for clarity (symbols are per Figure 1). Zero offset is shown by the dotted lines, which are offset from each other by 0.2 dex. Deviations of the data from these lines show when extra information about the mass-to-light ratio is provided by the secondary color above and beyond that predicted by B − V (Table 6). The trend is as expected: redder colors indicate higher mass-to-light ratios. The effect of V − I is essentially binary: there is an approximately constant shift in ![]() * above or below V − I ≈ 0.7. There is rather less information in J − Ks, though very red galaxies do tend to have higher
* above or below V − I ≈ 0.7. There is rather less information in J − Ks, though very red galaxies do tend to have higher ![]() *. The modest amplitude of these shifts imply that a single optical color contains most but not all of the information that can be used to constrain
*. The modest amplitude of these shifts imply that a single optical color contains most but not all of the information that can be used to constrain ![]() *.
*.
Other Images in This Article
Copyright and Terms & Conditions
© 2014. The American Astronomical Society. All rights reserved.