Image Details
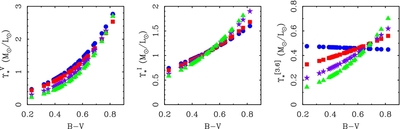
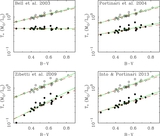
Caption: Figure 6.
Relation between B − V color and the stellar mass-to-light ratio in the V band (left), I band (center) and the Spitzer [3.6] band (right) after correction of each stellar population model (Table 5) to obtain self-consistency. Symbols as in Figure 1. The V-band panel is identical to that in Figure 1 as the models have been self-normalized to that band. Agreement between the models is improved in the other bands, though perceptible differences persist.
Other Images in This Article
Copyright and Terms & Conditions
© 2014. The American Astronomical Society. All rights reserved.
Copyright ©
2024 Astronomy Image Explorer. All Rights Reserved.