Image Details
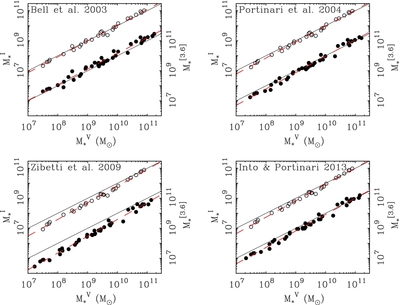
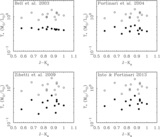
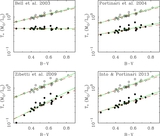
Caption: Figure 2.
Stellar masses (Table 3) estimated by population synthesis models (Bell et al. 2003; Portinari et al. 2004; Zibetti et al. 2009; Into & Portinari 2013, Table 2). For each model, the mass estimated from the either the I-band (open circles) or [3.6] luminosity (filled circles) of each galaxy is plotted against that estimated from the V-band luminosity. The two cases are offset for clarity. If the models were perfect the data would follow the solid lines of unity, modulo the expected intrinsic scatter in the relation between the mass-to-light ratio and color. Dashed lines show fits to the data (Table 4) quantifying the deviation from this ideal. These all have slopes greater than unity, indicating that the sensitivity of the mass-to-light ratio to color in I and [3.6] is overstated relative to that in V. The models also tend to over-predict the [3.6] luminosity relative to the optical luminosity, with the exception of the model of Bell et al. (2003), which underestimates it.
Other Images in This Article
Copyright and Terms & Conditions
© 2014. The American Astronomical Society. All rights reserved.