Image Details
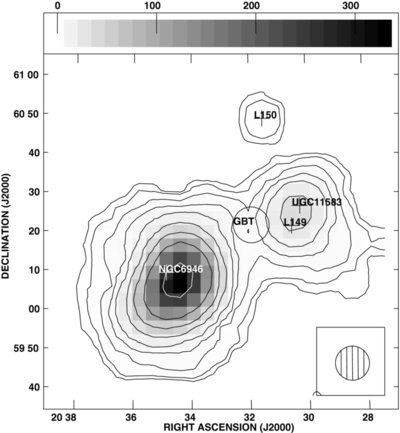
Caption: Figure 4.
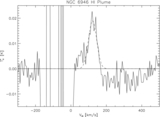
GBT total H i intensity map of NGC 6946, its companions, and putative H i filament. Contours are at 0.1, 0.2, 0.5, 1, 2, 5, 10, 20, and 500 × 10 19 cm −2. The grayscale is in units of K km s −1, proportional to the H i column density. The GBT beam is shown in the lower right. The known galaxies are marked with plus signs. The GBT label indicates the position for the spectrum shown in Figure 5.
Other Images in This Article
Copyright and Terms & Conditions
© 2014. The American Astronomical Society. All rights reserved.
Copyright ©
2025 Astronomy Image Explorer. All Rights Reserved.