Image Details
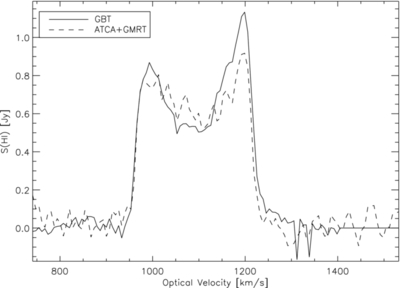
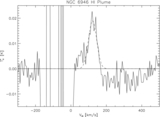
Caption: Figure 2.
Comparison of the H i spectrum of NGC 2997 from the GBT map (solid line) and from the GMRT+ATCA Hess et al. (2009) data (dashed line). Both spectra are integrated over the same area (0.24 deg 2) and have been sampled with the same channel spacing. It is clear that the two spectra agree within the noise except around 1200 km s −1 where the GBT has recovered more flux.
Other Images in This Article
Copyright and Terms & Conditions
© 2014. The American Astronomical Society. All rights reserved.
Copyright ©
2025 Astronomy Image Explorer. All Rights Reserved.