Image Details
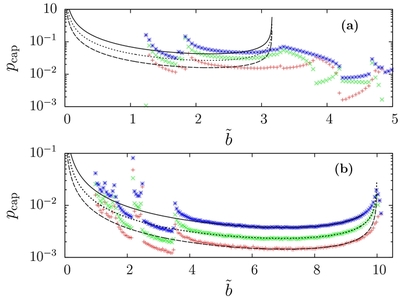
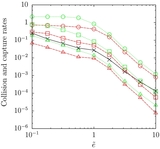
Caption: Figure 7.
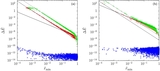
Capture probability
p
cap as a function of
 for the case with ζ = 10
−4. Panels (a) and (b) show
for the case with ζ = 10
−4. Panels (a) and (b) show
 and (10, 0), respectively. Red pluses and green crosses represent numerical results for prograde and retrograde trajectories,
respectively, and blue asterisks show the sum of them. Dashed, dotted, and solid lines show analytic results for
p
pro,
p
retro, and
p
total, respectively. We set
f
pro = 4.0,
f
retro = 2.0, and
f
ran = 2.0 in the analytic expressions given by Equations (18)–(20).
and (10, 0), respectively. Red pluses and green crosses represent numerical results for prograde and retrograde trajectories,
respectively, and blue asterisks show the sum of them. Dashed, dotted, and solid lines show analytic results for
p
pro,
p
retro, and
p
total, respectively. We set
f
pro = 4.0,
f
retro = 2.0, and
f
ran = 2.0 in the analytic expressions given by Equations (18)–(20).
Other Images in This Article
Show More
Copyright and Terms & Conditions
© 2013. The American Astronomical Society. All rights reserved.