Image Details
Caption: Figure 10.
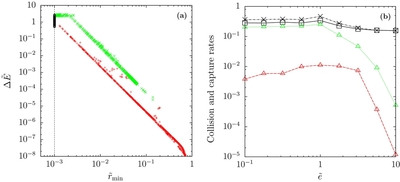
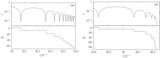
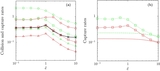
Results of orbital integration where both gas drag capture and direct collision are taken into account (
 ). (a) Energy dissipation
 a planetesimal receives until the end of orbital integration, shown as a function of
 (
(
 ). Red pluses, green crosses, and black circles show results for prograde, retrograde, and collision cases, respectively.
The dotted vertical line shows the physical radius of the planet. The cluster of points in the vertical band at
). Red pluses, green crosses, and black circles show results for prograde, retrograde, and collision cases, respectively.
The dotted vertical line shows the physical radius of the planet. The cluster of points in the vertical band at
 shows orbits that resulted in collision onto the planet, and those in the horizontal band at
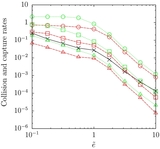
 represent those that resulted in capture by gas drag. (b) Collision and gas-drag capture rates as a function of eccentricity
 . Dashed, dotted, and solid lines show numerical results of
P
pro,
P
retro, and
P
col, respectively. The dot–dashed line shows numerical results for
P
col in the gas-free case, which is also shown in Figure
8(a).
. Dashed, dotted, and solid lines show numerical results of
P
pro,
P
retro, and
P
col, respectively. The dot–dashed line shows numerical results for
P
col in the gas-free case, which is also shown in Figure
8(a).
Other Images in This Article
Show More
Copyright and Terms & Conditions
© 2013. The American Astronomical Society. All rights reserved.