Image Details
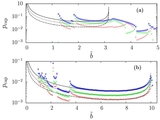
Caption: Figure 6.
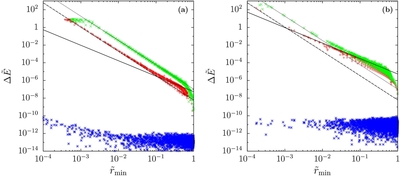
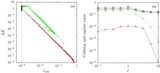
Energy change
 due to gas drag for each orbit, as a function of its minimum approach distance to the planet
 with ζ = 3 × 10
−9. Panels (a) and (b) show the results for
with ζ = 3 × 10
−9. Panels (a) and (b) show the results for
 and (30, 0), respectively. Red pluses and green crosses represent prograde and retrograde trajectories (see the text for
their definitions), respectively. Blue asterisks show energy change in the case without gas drag, that is, errors in our numerical
integration. Dashed and dotted lines show the analytic results for the prograde and retrograde shear-dominated cases, respectively.
The solid line shows the analytic result for the dispersion-dominated case.
and (30, 0), respectively. Red pluses and green crosses represent prograde and retrograde trajectories (see the text for
their definitions), respectively. Blue asterisks show energy change in the case without gas drag, that is, errors in our numerical
integration. Dashed and dotted lines show the analytic results for the prograde and retrograde shear-dominated cases, respectively.
The solid line shows the analytic result for the dispersion-dominated case.
Other Images in This Article
Show More
Copyright and Terms & Conditions
© 2013. The American Astronomical Society. All rights reserved.