Image Details
Caption: Figure 12.
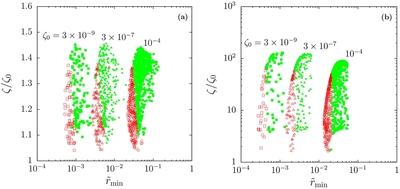
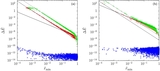
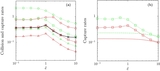
Values of non-dimensional gas drag parameter ζ for captured planetesimals at the end of orbital integration relative to initial
value ζ
0, as a function of their minimum approach distance to the planet
 . (a) Case with
 , and (b)
 . Red and green points represent prograde and retrograde trajectories at
 , respectively.
Other Images in This Article
Show More
Copyright and Terms & Conditions
© 2013. The American Astronomical Society. All rights reserved.
Copyright ©
2025 Astronomy Image Explorer. All Rights Reserved.