Image Details
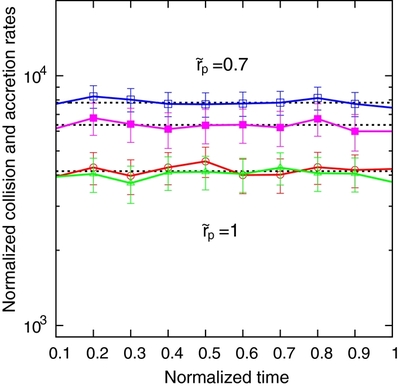
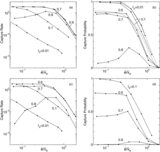
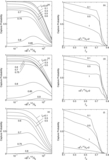
Caption: Figure 9.
Normalized collision rate (
 ) and accretion rate (
 ) as a function of the normalized time (
tτ), in the case where the effect of aggregate formation is neglected (see the text). Thin horizontal dotted lines represent
the results obtained from the three-body calculations: collision rate for
) as a function of the normalized time (
tτ), in the case where the effect of aggregate formation is neglected (see the text). Thin horizontal dotted lines represent
the results obtained from the three-body calculations: collision rate for
 (top), accretion rate for
 (middle), and collision rate for
 (bottom). Solid lines with marks and error bars represent the results of
N-body simulation: lines with open squares (colored blue) and filled squares (colored magenta) represent collision and capture
rates, respectively, for
(bottom). Solid lines with marks and error bars represent the results of
N-body simulation: lines with open squares (colored blue) and filled squares (colored magenta) represent collision and capture
rates, respectively, for
 and τ = 10
−2; and lines with circles (colored red) and triangles (colored green) represent collision rates for τ = 10
−3 and 10
−2, respectively, with
and τ = 10
−2; and lines with circles (colored red) and triangles (colored green) represent collision rates for τ = 10
−3 and 10
−2, respectively, with
 (ε
n = 0.5). Computer systems with the GRAPE-7 hardware were used for these
N-body simulations.
(ε
n = 0.5). Computer systems with the GRAPE-7 hardware were used for these
N-body simulations.
Other Images in This Article
Show More
Copyright and Terms & Conditions
© 2013. The American Astronomical Society. All rights reserved.