Image Details
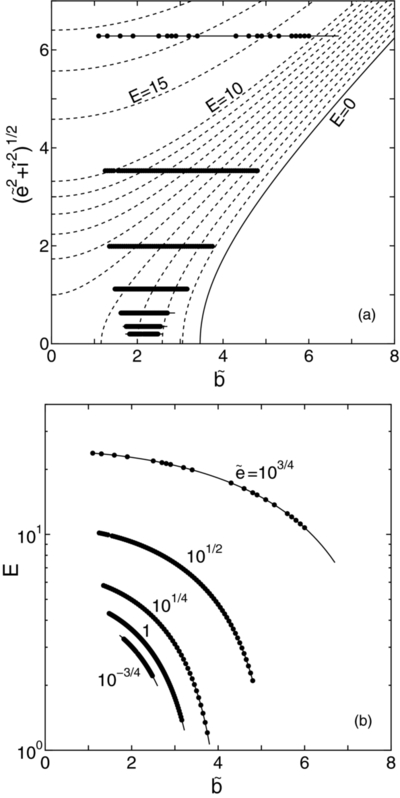
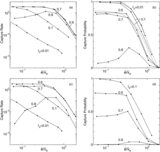
Caption: Figure 5.
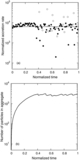
(a) Range of
 that leads to collision or capture orbits for
 on the
 –
–
 plane, where
 . The thin solid lines represent the range of
 for collision orbits, while the dots on these lines show the values of
 where at least one captured orbit was found. The contour lines of the initial values of
E (calculated from Equations (5) and (6) with
where at least one captured orbit was found. The contour lines of the initial values of
E (calculated from Equations (5) and (6) with
 ) are also shown, with an interval of 1 for 0 ⩽
E ⩽ 10 and 5 for
E ⩾ 10. (b) Plots of
E for collision and capture orbits as a function of
) are also shown, with an interval of 1 for 0 ⩽
E ⩽ 10 and 5 for
E ⩾ 10. (b) Plots of
E for collision and capture orbits as a function of
 .
.
Other Images in This Article
Show More
Copyright and Terms & Conditions
© 2013. The American Astronomical Society. All rights reserved.