Image Details
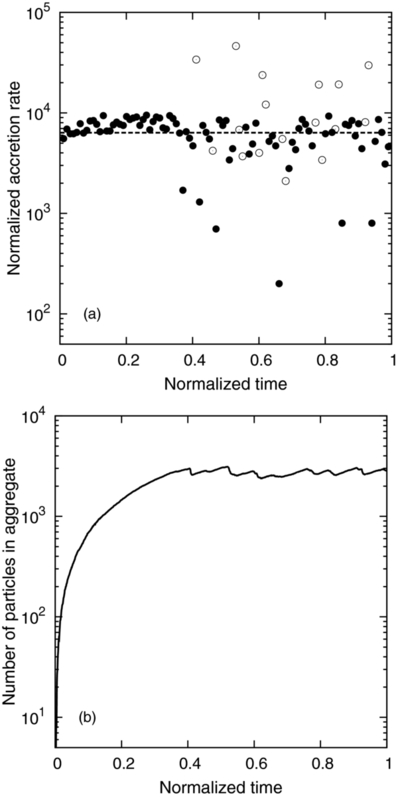
Caption: Figure 10.
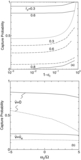
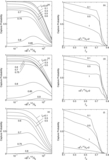
Numerical results of
N-body simulation for the case with the effect of aggregate formation (
 , ε
n = 0.5, τ = 10
−2). (a) Normalized accretion rates as a function of the normalized time. The horizontal dotted line represents the results
based on the three-body calculations, while the circles represent the results of
N-body simulation. Open circles represent negative values of the accretion rate. (b) Number of particles contained in the aggregate
formed on top of the moonlet, as a function of the normalized time.
, ε
n = 0.5, τ = 10
−2). (a) Normalized accretion rates as a function of the normalized time. The horizontal dotted line represents the results
based on the three-body calculations, while the circles represent the results of
N-body simulation. Open circles represent negative values of the accretion rate. (b) Number of particles contained in the aggregate
formed on top of the moonlet, as a function of the normalized time.
Other Images in This Article
Show More
Copyright and Terms & Conditions
© 2013. The American Astronomical Society. All rights reserved.
Copyright ©
2025 Astronomy Image Explorer. All Rights Reserved.