Image Details
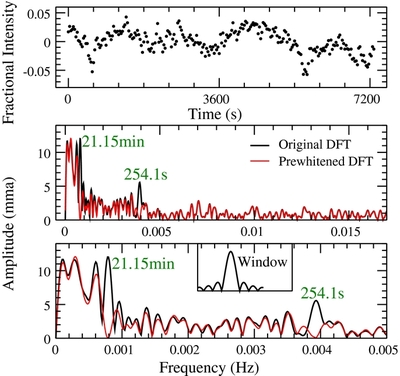
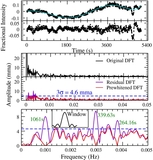
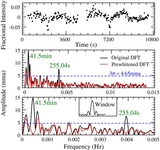
Caption: Figure 6.
Similar to Figure 4 showing APO data from 2011 November 5 (14 months after outburst) at magnitude 17.8 ± 0.1 with 30 s exposures. Two partial eclipses are evident in the light curve (Table 2). A signal consistent with the 256 s period evident in the COS data is detected. Due to the short length of the data set, the shuffling technique could not produce a good value of 3σ over the entire frequency range but an estimate for frequencies >0.005 Hz is 2.9 mma.
Other Images in This Article

Copyright and Terms & Conditions
© 2013. The American Astronomical Society. All rights reserved.
Copyright ©
2025 Astronomy Image Explorer. All Rights Reserved.