Image Details
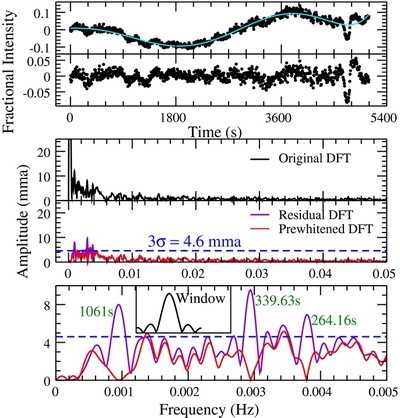
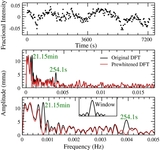
Caption: Figure 5.
APO 2010 November 8 data 1.5 months after outburst at magnitude 17.7 ± 0.2. Top panel shows original intensity light curve with 5 s exposures; underneath is this light curve with a low order polynomial fit subtracted to remove the low frequency trend. Middle panels 3 and 4 show DFTs of the above light curves while the bottom panel shows an expansion of the low frequencies in panel 4 and an inset with the window function. Dashed lines show the 3σ noise limit found from the shuffling technique. The pronounced dip near the end of the light curve is the partial eclipse, with time listed in Table 2. The 256 s period is not evident but is likely masked by the other variability due to the outburst.
Other Images in This Article

Copyright and Terms & Conditions
© 2013. The American Astronomical Society. All rights reserved.