Image Details
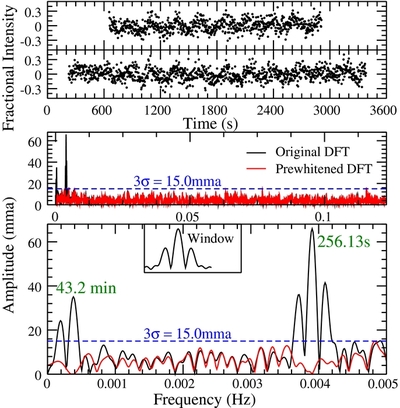
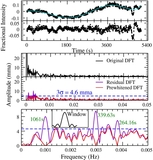
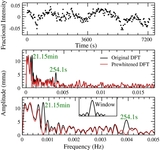
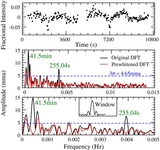
Caption: Figure 4.
COS intensity light curve 14 months after outburst with 3 s bins (top), DFT (middle), and an expansion of the low frequencies (bottom). Dashed line shows the 3σ noise limit found from the shuffling technique. Inset on bottom shows the window function for the data. The 256 s period is well detected.
Other Images in This Article
Copyright and Terms & Conditions
© 2013. The American Astronomical Society. All rights reserved.
Copyright ©
2025 Astronomy Image Explorer. All Rights Reserved.