Image Details
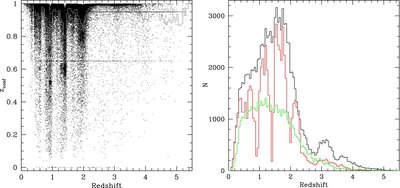
Caption: Figure 7.
Left panel: distribution in the zconf-redshift plane for the DR7 quasars. Black points indicate individual objects; the gray line shows the moving average in redshift bins of 0.05. Note the banding structure produced by the movement of strong emission lines through the SDSS spectrograph bandpass. A large number of low zconf values occur at the redshifts where there are fewer strong emission features in the SDSS spectra (see the text). Right panel: black histogram shows the raw redshift distribution of the DR7 quasars in the catalog. The red histogram displays the redshift distribution that results from applying a cut of zconf = 0.95 on the points in the left-hand panel; this selection produces an unphysical redshift distribution. This is not an issue for quasars in this catalog, but must be considered in any attempt to extend the catalog (e.g., to fainter quasars) for the purpose of statistical analyses. The green histogram corrects for the emission-line Malmquist bias and reveals the intrinsic redshift distribution for a fixed continuum luminosity (see the text).
Other Images in This Article
Copyright and Terms & Conditions
© 2010. The American Astronomical Society. All rights reserved.