Image Details
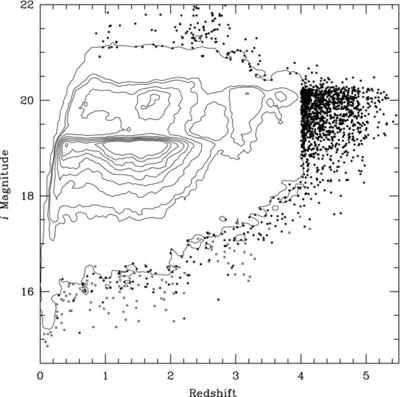
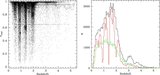
Caption: Figure 4.
Observed i magnitude as a function of redshift for the 105,783 objects in the catalog. Open circles indicate quasars that were recovered, but not discovered, by the SDSS. The distribution is represented by a set of linear contours when the density of points in this two-dimensional space would cause the points to overlap. The steep gradients at i ≈ 19.1 and i ≈ 20.2 are due to the flux limit for the targeted low- and high-redshift parts of the survey; the dip in the counts at z ≈ 2.7 arises because of the high incompleteness of the SDSS Quasar Survey at redshifts between 2.5 and 3.0 (also see Figure 5).
Other Images in This Article
Copyright and Terms & Conditions
© 2010. The American Astronomical Society. All rights reserved.