Image Details
Caption: Figure 6.
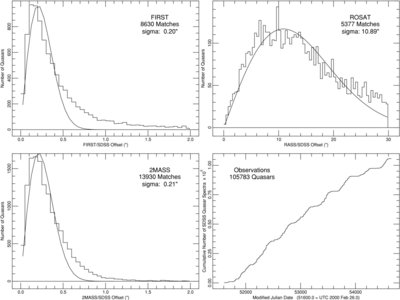
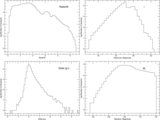
Upper row and lower left panels show the distribution of the angular offsets between the SDSS positions and those of the FIRST,
ROSAT, and 2MASS coordinates, respectively. The matching radii for the surveys were 2
![]() 0 (FIRST), 30
0 (FIRST), 30
![]() 0 (
ROSAT), and 2
0 (
ROSAT), and 2
![]() 0 (2MASS). The smooth curves in each of these panels is the expected distribution for a set of matches if the offsets between
the objects are described by a Rayleigh distribution; the dispersions of the fit are given in each panel. Only points with
separations of less than 1
0 (2MASS). The smooth curves in each of these panels is the expected distribution for a set of matches if the offsets between
the objects are described by a Rayleigh distribution; the dispersions of the fit are given in each panel. Only points with
separations of less than 1
![]() 0 were used in fitting the Rayleigh distribution in the FIRST and 2MASS matching. In the 2MASS case, only points that were
actual matches to the published 2MASS catalog are displayed. The Rayleigh distribution is a poor fit to the FIRST and 2MASS
matches, as both data sets have a much higher than expected number of matches at radii larger than ≈0
0 were used in fitting the Rayleigh distribution in the FIRST and 2MASS matching. In the 2MASS case, only points that were
actual matches to the published 2MASS catalog are displayed. The Rayleigh distribution is a poor fit to the FIRST and 2MASS
matches, as both data sets have a much higher than expected number of matches at radii larger than ≈0
![]() 5. The lower right panel displays the cumulative number of DR7 quasars as a function of time; the observations occurred between
2000 February and 2008 July. The roughly periodic structure in the curve is produced by the yearly summer maintenance schedule
and, late in the survey, the limited number of quasar observations during the Fall once that portion of the Legacy Survey
spectroscopy was completed.
5. The lower right panel displays the cumulative number of DR7 quasars as a function of time; the observations occurred between
2000 February and 2008 July. The roughly periodic structure in the curve is produced by the yearly summer maintenance schedule
and, late in the survey, the limited number of quasar observations during the Fall once that portion of the Legacy Survey
spectroscopy was completed.
Other Images in This Article
Copyright and Terms & Conditions
© 2010. The American Astronomical Society. All rights reserved.