Image Details
Caption: Figure 3.
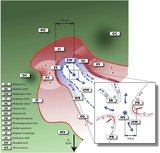
Same field of view as in Figures 1 and 2 is shown in both panels. The left panel shows the ratio of F658N/F656N ([N ii]/Hα) and the right panel shows the ratio of F502N/F656N ([O iii]/Hα). Both are intended to show the systematic ionization changes across the Huygens region. The left panel is little affected by local variations in interstellar reddening, while the right panel is. The dashed line indicates the boundary where radial shadows begin. The inner boundary of the [O iii] shell feature discussed in Section 2.6 is outlined with a curved solid line. The lighter solid line indicates the southwest boundary of a high-ionization region close to the Trapezium stars. The circles are centered on the proplyds that have stand-off shocks, which indicate that they lie within the unshocked hypersonic SW from θ 1 Ori C.
Other Images in This Article

Copyright and Terms & Conditions
© 2009. The American Astronomical Society. All rights reserved.