Image Details
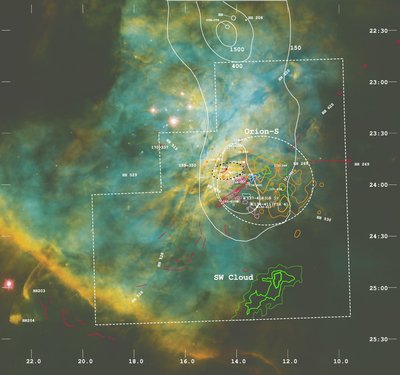
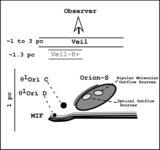
Caption: Figure 1.
This 233'' × 219'' image is composed of a mosaic of WFPC2 images (O'Dell & Wong 1996) with F502N ([O iii]) as blue, F656N (Hα) as green, and F658N ([N ii]) as red. North is up and the labels along the edge depict the right ascension beyond 5:30:00 and the declination south of −5:20:00 (2000). Major outflow features are labeled in addition to objects discussed in the text. Throughout this paper a position-based designation is used (O'Dell & Wen 1994) except for large individual features such as Herbig Haro objects. The white dashed ellipse encloses the smaller features collectively discussed in the text as the Orion-S feature. The red lines and circles represent strong IR H 2 features (Kaify et al. 2000; Stanke et al. 2002) not associated with the BN–KL deeply embedded sources. The strong dark red/blue contoured lines indicate CO outflow (Zapata et al. 2005) and the pastel-colored pink/light-blue contoured lines indicate SiO outflow (Zapata et al. 2006). The orange contours are H 2CO absorption features (Mangum et al. 1993) at the level of −80 K km s −1 (heavier) and −50 K km s −1 (lighter). The green contours of increasing thickness depict regions of the difference of extinction ( c dif hβ as defined in Section 2.4) of 0.1, 0.2, and 0.3. The sharp boundary of the more southerly c dif hβ excess feature is the result of reaching the edge of the WFPC2 field of view. The region most likely to contain the sources of the high-velocity optical outflows is shown as a dark dashed ellipse (O'Dell & Henney 2008). The open squares indicate the positions of H 2O maser sources (Gaume et al. 1998). The point sources within the dashed outline are coded by the shortest wavelength of their detection, with filled white squares indicating the positions of radio-only visible sources (Zapata et al. 2004a, 2004b, 2005), red squares the positions of sources seen only in the mid-IR (Smith et al. 2004; Robberto et al. 2005), and filled orange circles the positions of stars in the near-IR catalog of Hillenbrand & Carpenter (2000). The white contours show the 350 μm emission in this area (Houde et al. 2004) in units of Jy per 12'' beam. The irregular dashed white line indicates the field where c Hβ was determined both by the radio/optical and optical line ratio methods.
Other Images in This Article
Copyright and Terms & Conditions
© 2009. The American Astronomical Society. All rights reserved.