Image Details
Caption: Fig. 12.
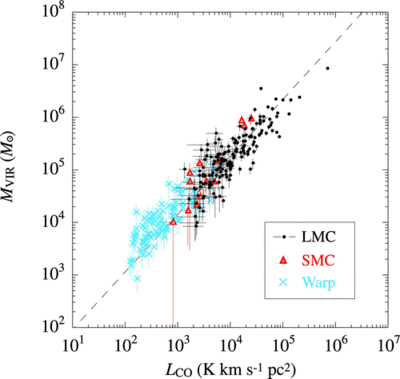
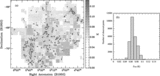
Virial mass, Mvir of the GMCs as a function of luminosity, LCO (filled circles). The line present a best fit to the data with a slope of ﹩1.1\pm 0.1﹩. Triangles show the clouds in the SMC (Mizuno et al. 2001a) and crosses those in the Warp region (Nakagawa et al. 2005); the clouds in these regions are reidentified as for the LMC clouds by using the algorithm described by Rosolowsky & Leroy (2006).
Other Images in This Article

Show More
Copyright and Terms & Conditions
© 2008. The American Astronomical Society. All rights reserved. Printed in U.S.A.
Copyright ©
2025 Astronomy Image Explorer. All Rights Reserved.