Image Details
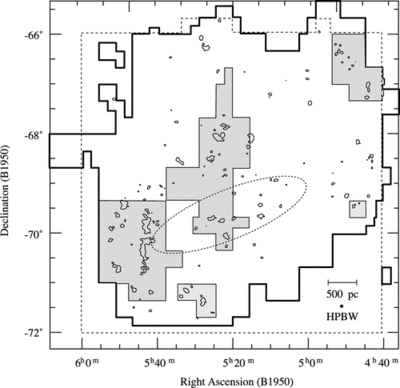
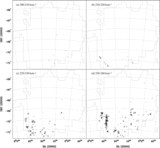
Caption: Fig. 1.
Area of survey. The boundary of the observed region in this work is indicated by the thick solid lines; the areas shaded in gray indicate the regions observed by the narrowband spectrometer (see § 2). Overlaid is the velocity‐integrated intensity distribution of CO of the first survey, whose boundary is shown by the dashed line (Fukui et al. 1999; Mizuno et al. 2001b). The contours are at the 5 σ noise level (3 K km s−1) of the velocity‐integrated intensity of the first survey, showing that the present survey covers the entire region where CO emission was detected. The ellipse illustrates the position of the bar.
Other Images in This Article

Show More
Copyright and Terms & Conditions
© 2008. The American Astronomical Society. All rights reserved. Printed in U.S.A.