Image Details
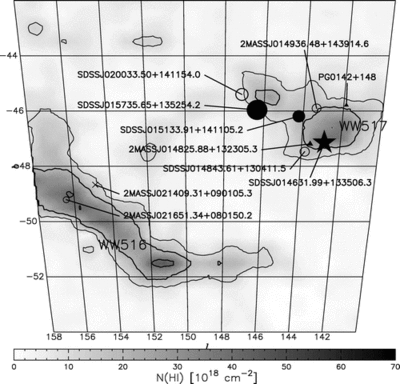
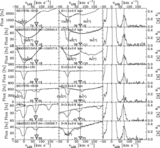
Caption: Fig. 2.
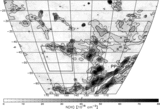
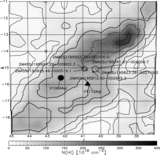
Map of the column density of the Cohen Stream, integrating the LAB data of Kalberla et al. (2005) between ﹩v_{\mathrm{LSR}\,}=-130﹩ and −80 km s−1. Contours are at column densities of ﹩1\times 10^{19}﹩, ﹩2\times 10^{19}﹩, and ﹩4\times 10^{19}﹩ cm−2. The locations of the background stars are overlaid. The size (i.e., area) of the symbols is proportional to the distance of the star. Filled circles are for directions where the HVC is detected in absorption. Filled triangles are for significant nondetections. Open circles are for nondetections that do not allow a conclusion concerning the HVC’s distance. Crosses are for stars where the interstellar absorption is too blended with stellar lines. The QSO is shown by a five‐pointed star instead of a filled circle.
Other Images in This Article
Copyright and Terms & Conditions
© 2008. The American Astronomical Society. All rights reserved. Printed in U.S.A.