Image Details
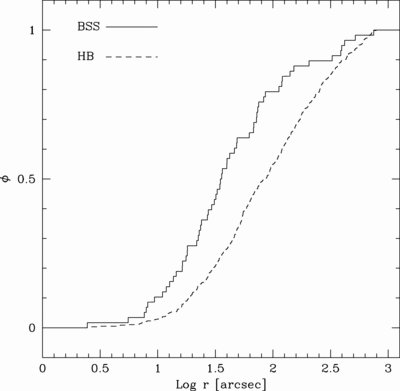
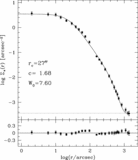
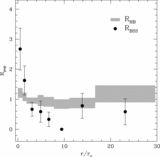
Caption: Fig. 9.
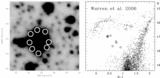
Cumulative radial distribution of BSSs (solid line) and HB stars (dashed line) as a function of the projected distance from the cluster center for the combined HST+WFI sample. The two distributions differ at ~4 σ level.
Other Images in This Article
Show More
Copyright and Terms & Conditions
© 2007. The American Astronomical Society. All rights reserved. Printed in U.S.A.
Copyright ©
2025 Astronomy Image Explorer. All Rights Reserved.