Image Details
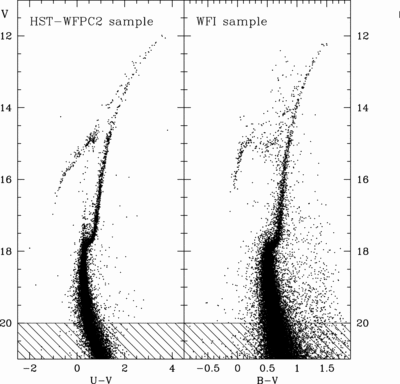
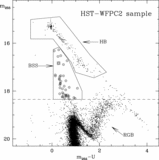
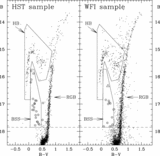
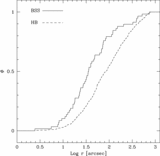
Caption: Fig. 3.
Optical CMDs of the HST WFPC2 and the WFI samples. The hatched regions indicate the magnitude limit (﹩V\leq 20﹩) adopted for selecting the stars used to construct the cluster surface density profile.
Other Images in This Article
Show More
Copyright and Terms & Conditions
© 2007. The American Astronomical Society. All rights reserved. Printed in U.S.A.
Copyright ©
2025 Astronomy Image Explorer. All Rights Reserved.