Image Details
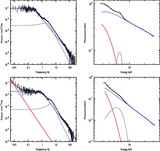
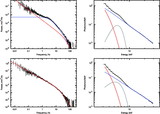
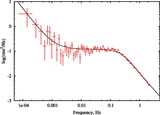
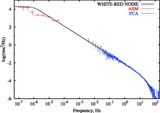
Caption: Fig. 12.
RXTE PCA power spectra (left) and power × ν diagrams (right) of GRO J1655−40 (top) and XTE 1859+226 (bottom). One can clearly see QPO frequencies ﹩\nu _{\mathrm{dr}\,}﹩ at ~10–20 Hz for GRO J1655−40 and ~185 Hz for XTE 1859+226 before an HF cutoff. The rms2 power at ﹩\nu _{\mathrm{dr}\,}﹩ is comparable (GRO J1655−40) or higher (XTE 1859+226) than that at LFs (right).
Other Images in This Article

Show More
Copyright and Terms & Conditions
© 2007. The American Astronomical Society. All rights reserved. Printed in U.S.A.
Copyright ©
2025 Astronomy Image Explorer. All Rights Reserved.