Image Details

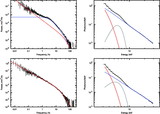
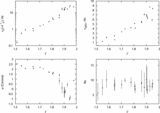
Caption: Fig. 2.
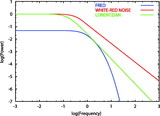
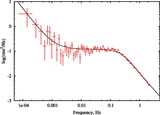
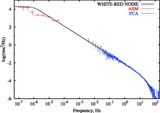
Cyg X‐1: Observable power spectrum (PDS) (left) vs. photon spectrum (right) from observations 40099‐01‐05‐00 (top) and 50119‐01‐04‐01 (bottom). The first observation is a pure low‐hard state with no LF WRN component in the PDS. During the second observation the source energy spectrum is still hard, but LF WRN is already detectable. Data points are shown with error bars. The PDS is fitted by a product of the sum of LF and HF WRN power spectra and a zero‐centered Lorentzian (see eq. [85]). We also use Lorentzians to fit QPO features. The model fit χ2 are shown in Table 1. The black line is for the resulting PDS; red and blue lines present LF and HF components, respectively. The photon spectrum is fitted by a BMC+GAUSSIAN model. The resulting model spectrum is shown in black, while red and blue curves present thermal and Comptonized components, respectively. The gray line shows the Gaussian of the Kα line located at 6.4 keV.
Other Images in This Article

Show More
Copyright and Terms & Conditions
© 2007. The American Astronomical Society. All rights reserved. Printed in U.S.A.