Image Details
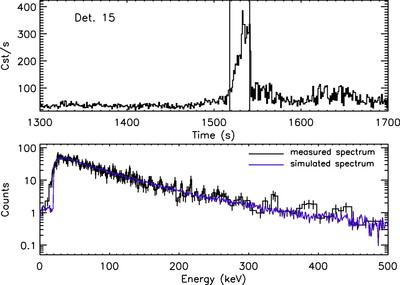
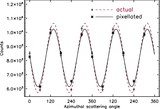
Caption: Fig. 4.
Top panel shows the singles light curve of detector 15 in the 30–490 keV band. No dead time correction is applied. The solid vertical lines indicate the region (R1) for which the spectrum is extracted. The bottom panel shows the measured (black histogram) and the simulated (purple histogram) spectrum.
Other Images in This Article

Copyright and Terms & Conditions
© 2007. The American Astronomical Society. All rights reserved. Printed in U.S.A.
Copyright ©
2025 Astronomy Image Explorer. All Rights Reserved.