Image Details
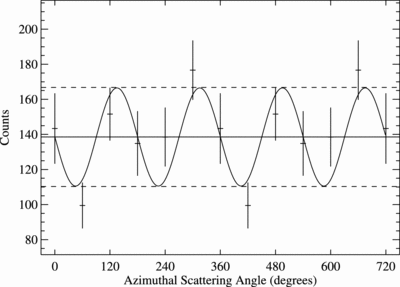
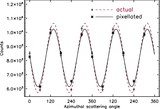
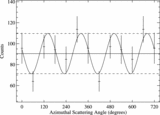
Caption: Fig. 11.
Azimuthal scattering angle distribution of events in regions 1, 2, and 3 and a ﹩\mathrm{cos}\,2( \phi -\eta ) ﹩ fit to the data. The solid line shows the average (no polarization), and the dashed lines show the maximum and the minimum modulation for a 100% polarization fraction.
Other Images in This Article


Copyright and Terms & Conditions
© 2007. The American Astronomical Society. All rights reserved. Printed in U.S.A.
Copyright ©
2025 Astronomy Image Explorer. All Rights Reserved.