Image Details
Caption: Fig. 3.
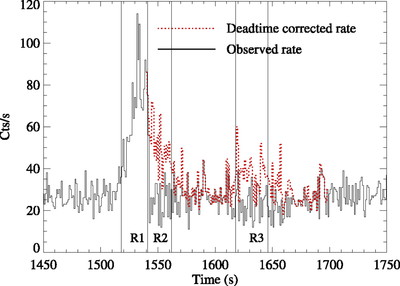
Observed (black histogram) and the reconstructed (red histogram) light curve of MEs in the 100–500 keV band. The gaps are treated as dead time. The vertical solid lines separate R1, R2, and R3 regions (see text).
Other Images in This Article


Copyright and Terms & Conditions
© 2007. The American Astronomical Society. All rights reserved. Printed in U.S.A.
Copyright ©
2025 Astronomy Image Explorer. All Rights Reserved.