Image Details
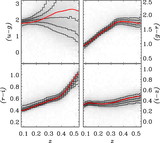
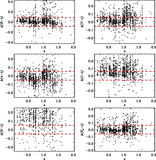
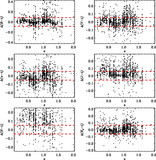
Caption: Fig. 17.
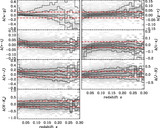
Our galaxy stellar mass estimates, ﹩M_{*}﹩, compared to those of Kauffmann et al. (2003), ﹩M_{s,*}﹩, as a function of stellar mass (top) and of color (bottom). The gray scale is the conditional distribution ﹩M_{s,*}/ M_{*}﹩ on each quantity. The lines are the 10%, 25%, 50%, 75%, and 90% quantiles.
Other Images in This Article

Show More
Copyright and Terms & Conditions
© 2007. The American Astronomical Society. All rights reserved. Printed in U.S.A.
Copyright ©
2025 Astronomy Image Explorer. All Rights Reserved.