Image Details

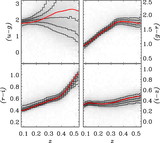
Caption: Fig. 2.
Star formation history corresponding to LRG spectral template of Fig. 1. Top: Number of stars formed per logarithmic time interval (t expressed in years, curve normalized for a 1012 M⊙ galaxy). Almost all of the stars are formed in the first couple of billion years; note that the recent "spike" represents a tiny fraction (~10−8) of the total number of stars. Bottom: Mean metallicity of the population as a function of time. Note that the details of these functions are rather poorly constrained.
Other Images in This Article
Show More
Copyright and Terms & Conditions
© 2007. The American Astronomical Society. All rights reserved. Printed in U.S.A.
Copyright ©
2025 Astronomy Image Explorer. All Rights Reserved.