Image Details
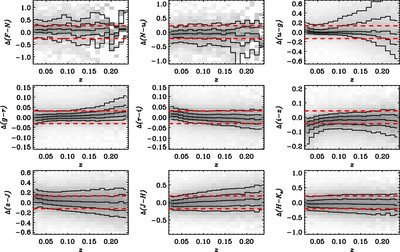
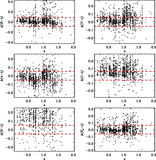
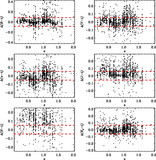
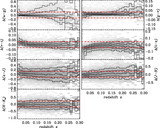
Caption: Fig. 5.
Color residuals (defined explicitly in the text) of GALEX, SDSS, and 2MASS observations relative to our best‐fit five‐template model. The gray scale is the conditional distribution of the color residual given the redshift. The thin lines are the 10%, 25%, 50%, 75%, and 90% quantiles of the distribution. The thick dashed lines show the estimated 1 σ uncertainties in the colors from the photometric catalogs. Relative to the uncertainties, there are no significant biases or redshift trends in these fits.
Other Images in This Article

Show More
Copyright and Terms & Conditions
© 2007. The American Astronomical Society. All rights reserved. Printed in U.S.A.
Copyright ©
2025 Astronomy Image Explorer. All Rights Reserved.