Image Details
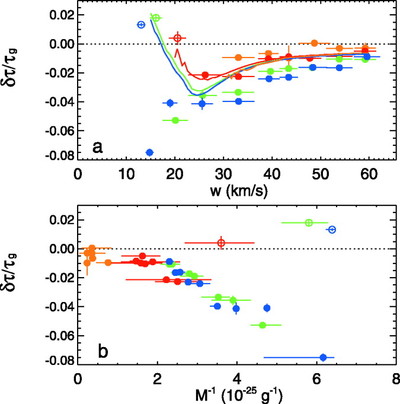
Caption: Fig. 3.
(a) Mean travel‐time perturbations, averaged over all sunspot umbrae in the four spot groups observed, divided by the group travel times as functions of the phase speed w, where the orange, red, green, and blue symbols indicate results for ﹩\nu _{0}=2﹩, 3, 4, and 5 mHz, respectively. The open circles indicate the filter and frequency combinations which are dominated by the ﹩p_{1}﹩‐mode. Horizontal bars indicate the range of ﹩w﹩ present within the filter and frequency bandpass, and the vertical bars indicate the standard deviation of the mean. The colored lines indicate the predicted values computed from a sound‐speed proxy (see text), where the colors indicate the same ﹩\nu _{0}﹩ as the observations. (b) Fractional travel‐time perturbations as a function of the inverse of the mean mode mass.
Other Images in This Article
Copyright and Terms & Conditions
© 2006. The American Astronomical Society. All rights reserved. Printed in U.S.A.