Image Details

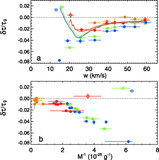
Caption: Fig. 2.
Scatter plots of ﹩\delta \tau ﹩ against the total magnetic flux density ﹩B_{\mathrm{tot}\,}﹩ (estimated from the MDI line‐of‐sight magnetogram assuming the magnetic field is the gradient of a potential). For clarity, only 1 out of 15 points is plotted. The vertical bars indicate the range of ±1 standard deviation about the mean over bins equally spaced over the logarithm of the flux density. The three cases shown are representative samples of the types of variations observed: (a) shows the results for filter A at ﹩\nu _{0}=5﹩ mHz, (b) shows filter C at 3 mHz, and (c) shows filter E at 4 mHz.
Other Images in This Article
Copyright and Terms & Conditions
© 2006. The American Astronomical Society. All rights reserved. Printed in U.S.A.