Image Details
Caption: Fig. 1.
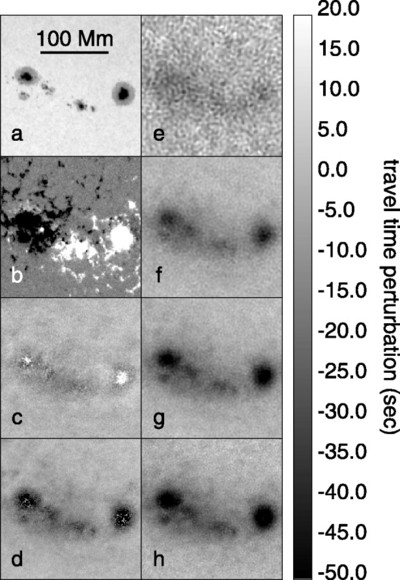
(a) MDI intensity, (b) line‐of‐sight magnetogram, and (c–h) sample maps of the mean travel‐time perturbation covering a portion of the region studied and showing sunspot group AR 9885. Panels c and d show travel‐time maps for filter C at 3 and 4 mHz, respectively (see Table 1). Panels e–h show the travel‐time maps for filter E at 2, 3, 4, and 5 mHz, respectively.
Other Images in This Article
Copyright and Terms & Conditions
© 2006. The American Astronomical Society. All rights reserved. Printed in U.S.A.
Copyright ©
2025 Astronomy Image Explorer. All Rights Reserved.