Image Details
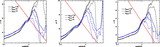
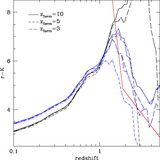
Caption: Fig. 8.
Estimated redshift distribution based on a linear fit to the K‐z Hubble diagram. The hatched histogram represents lower limit redshift estimates from the magnitude lower limits. The dashed histogram shows the distribution expected from convolving the Dunlop & Peacock (1990) ﹩dN/ dz﹩ with our selection criteria.
Other Images in This Article
Show More
Copyright and Terms & Conditions
© 2006. The American Astronomical Society. All rights reserved. Printed in U.S.A.
Copyright ©
2025 Astronomy Image Explorer. All Rights Reserved.